NavList:
A Community Devoted to the Preservation and Practice of Celestial Navigation and Other Methods of Traditional Wayfinding
From: John Karl
Date: 2013 Mar 12, 09:53 -0700
John's answers to 22778 post by Hanno Ix:
1. Hanno: In the posting 122774 you state that the 3D Normal Distribution is the prob density of the ship's location. Yes, you can make good a-priory assumption about throwing coins, but I wonder how you can know any prob density of a ship's location a-priory ?
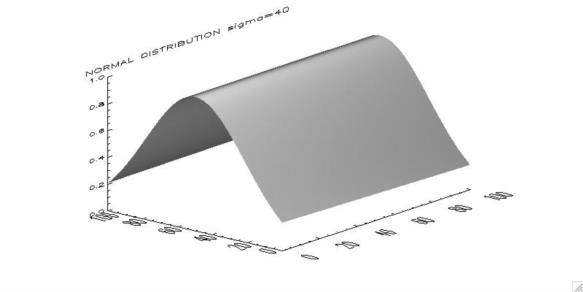
John: Each of the three LOPs have zero uncertainty in azimuth and a normal distribution in the intercept distance. The intercept standard deviation is known a priori from previously taking many sights using the same sextant by the same observer. (E.g., with my eyesight and sextant, it’s about 3nm; many observers can do much better.) This distribution of a single LOP is shown in the first attachment below. And as shown at https://NavList.net/imgx/f1-Cocked-Hat-V2.pdf the probability distribution of the ship is the product of the three Gaussians for each LOP.
2. Hanno: If you please will forgive me: below there is a remark of yours that makes no sense to me:
“What counts most at sea is not your best estimate of where you are, but the confident knowledge of where you're not”.
Assume you can only be at one of two not-overlapping locations called "A" and "NOT-A", and there is no other possible location for you to be, then both "alternatives" you cite are not contradictions but synonyms, and the "but" has no meaning. You can conclude one half of the statement from the other. Maybe you are trying to say something else that I could not understand?
John: There’s only one continuous region. Not two. The max prob/area is inside the cocked hat at the symmedian point. The probability decreases toward zero as we move away from that point. And we’re pretty confident that we’re not in a region outside the triangle plus a distance all around it of, say, several standard deviations of our personal altitude measures.
3. Hanno: Please, what is the difference of a "probability problem" and the "determination" of the "Maximum Probability Point"?
John: I tried to address this in the third paragraph of my post no. 22778. Be glad to attempt an answer to any more specific question you may have.
4. Hanno: I proceed like this: Using the known coordinates of stars and the center of the Earth as my reference frame, I have CelNav as means, with known errors and error distributions, to measure those coordinates. I can then deduce with the knowledge accessible to me where the ship most likely is.
John: But you’re not doing what you say. You do not determine an estimation of the ship’s position from current measurements and their uncertainties. Your example started out knowing where the ship is. Then you plotted the normal distributions about the known location of the ship. Moreover, in using St. Hilaire LOPs to plot a cocked hat we don’t have probability distribution of latitudes and longitudes of the ship’s location.
In fact I don’t understand what you’ve attempted in your 22753 post. Apparently you’d like to numerically calculate the probability distribution of a 1D continuous variable (the relative number of locations at a given distance from the ship’s given TL) from a given continuous 2D distribution of lats and lons. This result should be a probability per unit distance. We can see from your 2D picture of blue dots that this would be maximum at the TL, where there’s the maximum blue dot density. But you are not calculating this relative number of occurrences at a given distance. You’re calculating the radial distances for given occurrences. Note that your G has the dimensions of distance, not occurrences.
And two more points: the probability of getting the ship’s location from these lats & Lons is just the product of the two Gaussians, no need for a numerical solution. Furthermore, we don’t measure lats & lons when we plot the darned old cocked hat.
Hanno: It is however possible to draw different conclusions from different observances and different methods.
John: Yes that’s right. But you didn’t calculate what I think you wanted to. Goudsmit does have correct solutions to the problem he presented. But neither his nor your calculations apply to the three St. Hilaire LOPs forming a cocked hat.
----------------------------------------------------------------
NavList message boards and member settings: www.fer3.com/NavList
Members may optionally receive posts by email.
To cancel email delivery, send a message to NoMail[at]fer3.com
----------------------------------------------------------------


