NavList:
A Community Devoted to the Preservation and Practice of Celestial Navigation and Other Methods of Traditional Wayfinding
From: Frank Reed
Date: 2010 Jun 12, 12:19 -0700
Herbert, you wrote:
"You meant to say 78.5."
Yes. 90-11.5 is 78.5 ...not 87.5. :)
Unfortunately, that wasn't the end of my arithmetic errors while looking at this image so I'll just start over (for the record, from my "back of the envelope" notes, it appears that I subtracted 158 from 166 and got 6 --ouch).
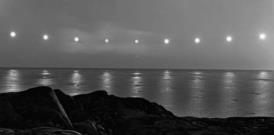
I measured the diameter of the central Sun image in pixels. That's about 8 pixels at the scale displayed on the web page. Then I counted pixels from the Sun's LL to the horizon. I get 66. Given the Sun's diameter of 32', the altitude of the Sun's LL is about 264' or 4.5 degrees +/- 0.25 degrees (my estimate of the uncertainty in the scaling based on the Sun's diameter). We can also count pixels from the right-hand limbs of the two central Sun images and for that I get an angle of 5.1 degrees which fits well with the caption's statement that the exposures were about twenty minutes apart. I'm figuring a net of near zero for dip, refraction and SD so the corrected altitude of the Sun's center is again just about 4.5 degrees. That minimum altitude of the Sun below the pole, along with the latitude of 78.5, implies that the Sun's declination was 16.0 degrees +/- 0.25d. The date then would be near 15h GMT August 9, 1947 +/- one day. Local midnight at Refuge Harbor, Greenland would be around 0500 GMT. That rules out Aug. 8 so the time was either 0500 on August 9 or 0500 on August 10 (Greenwich dates). Again, I am assuming that this photo was taken in summer, after the solstice. The same declination would have occurred around May 5. I would expect more ice around that date, so I am going with the August date.
You asked:
"How do you explain the steadily increasing sun diameter towards the sides of the picture?"
Clear sky. The images near the center are covered by some clouds or fog which would make a nice sun filter (given the right kind of clouds). I interpreted the images away from the center as over-exposed images of the Sun in clear sky. Don't they look over-exposed?? The images of the Sun fourth and fifth from the left appear to have been nicely dimmed by the clouds which are clearly visible in the image (of course, being a multiple exposure, the clouds could have been photographed at some other time but that's not likely since they would need to be significantly backlit to show up in a short exposure).
What about the earlier and later altitudes and azimuths? Here's where you have to deal with some "plate constants" as they say in astrometry. If we apply the scaling as above of 4 minutes of arc per pixel, the apparent azimuths in degrees away from the fifth Sun image are -21.3, -15.7, -10.3, -5.1, 0, 5.2, 10.5, 15.9, 21.6. The apparent altitudes of the Sun's center corrected for refraction and dip are 5.3, 4.9, 4.6, 4.4, 4.4, 4.4, 4.6, 5.0, 5.4. Clearly the differences between the azimuths are greater near the outer limits of the image. The spacing is 5.6 and 5.7 degrees between the outer pairs while it's 5.1/5.2 right near the center of the image. Usually, this would imply that the altitudes would be distorted by a similar amount in the same part of the field of view. That is, if a measured horizontal angle is 5.7 degrees when we have reason to believe it should be 5.1, then a measured vertical angle of 5.7 degrees in the same part of the image should be corrected to 5.1 degrees. So if I take the corrected altitudes and scale them by a factor such that the differences in azimuths are all the same (e.g. the first altitude is scaled by 5.1/5.7) then I get this sequence of corrected altitudes: 4.8, 4.65, 4.45, 4.4, 4.4, 4.4, 4.5, 4.65, 4.8. If I calculate the altitudes for these azimuths, I get 5.1, 4.8, 4.6, 4.4, 4.4, 4.4, 4.6, 4.8, 5.1. That's not too bad. The calculated altitudes are just about half-way between the original altitudes and the modified altitudes and within the margin of error in any case. So the image seems consistent with a simple projection. Note that if you take the Sun from the center of the image and increase its size by 12% (the scale factor near the edge) you don't get anything like the images of the Sun on the left and right. They are over-exposed images rather than just enlarged by projection.
George, I think, asked about sunspots. At this scale only the very largest of sunspots would show up. There was a huge one famously earlier in 1947. Can anyone find a sunspot photo/drawing for August 9, 1947?
I'm attaching a screen capture of the NG image, cropped a bit, in case anyone wants to play with it and could not figure out how to grab it from the web page.
-FER
----------------------------------------------------------------
NavList message boards and member settings: www.fer3.com/NavList
Members may optionally receive posts by email.
To cancel email delivery, send a message to NoMail[at]fer3.com
----------------------------------------------------------------


