NavList:
A Community Devoted to the Preservation and Practice of Celestial Navigation and Other Methods of Traditional Wayfinding
Re: Weighted least squares
From: Peter Hakel
Date: 2010 Dec 19, 13:07 -0800
From: Peter Fogg <piterr11@gmail.com>
To: NavList@fer3.com
Sent: Sat, December 18, 2010 2:46:53 PM
Subject: [NavList] Re: Weighted least squares
From: Peter Hakel
Date: 2010 Dec 19, 13:07 -0800
Your points are well taken. The "exactness" of time values pertains to one of the mathematical assumptions behind the derivation of the fitting formulae. In this case however, since we are doing linear fits, we get a lucky break in that the usefulness of the obtained procedure is not limited by this assumption.
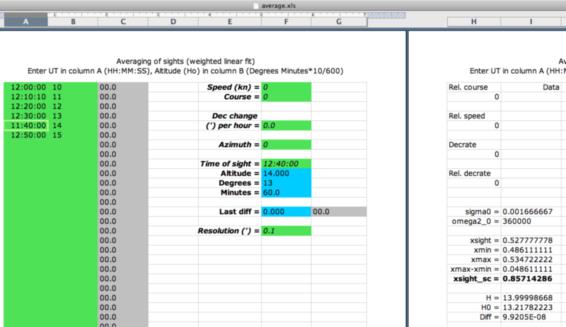
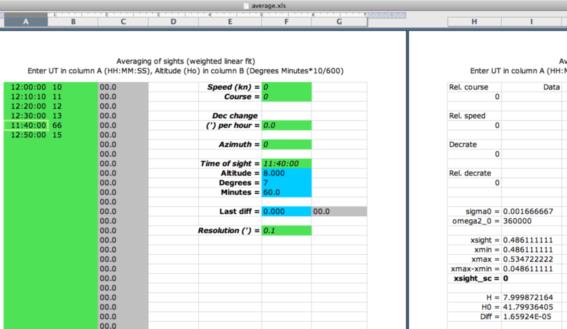
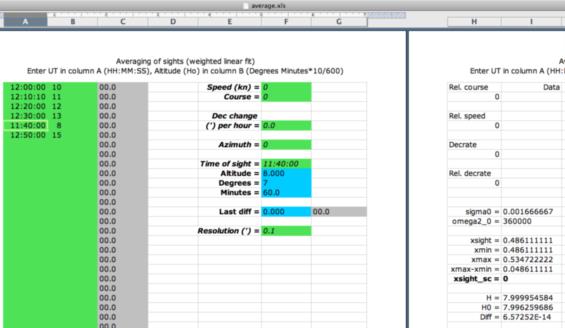
I attach three more screenshots of the same average.xls spreadsheet, now also fed with an erroneous time value. You can see that after getting the first (bad) fitted value from the initial non-weighted least-squares ("H0" in the lower right corner), the spreadsheet still manages to throw the bad data point out and in the end compute a value in line with the others.
The reason for this is that this is a linear fit, and therefore any altitude value is exactly correct for some specific time value - and, conversely, any time value is exactly correct for some specific altitude. So, a navigator looks at time_error.png and identifies the sight #5 as having a mis-recorded time. The fitting algorithm, on the other hand, takes the 11:40:00 as the exact time but then treats the altitude=14 as the bad data point that really should be 8 (see the other two attached images).
So in the end it all works out OK from either point of view. There is an additional assumption of linear one-to-one correspondence between times and altitudes but I think that there is no practical need to worry about the special case of slope=0. :-)
Peter Hakel
From: Peter Fogg <piterr11@gmail.com>
To: NavList@fer3.com
Sent: Sat, December 18, 2010 2:46:53 PM
Subject: [NavList] Re: Weighted least squares
P H wrote:
One of the ways apparent outliers are created is by the mis-recording of time. Its easy enough to do and just as likely to occur as writing down the incorrect altitude. I know this because I've done both, and have also been affected by this vice when using a scribe to record observation data. Since one number looks so like another this error may not be picked up during an averaging or linear-fit exercise. However, if you graph those sights and compare them with the calculated (= true) slope, then such outliers immediately jump out and loudly exclaim: "Hey, look at me! Why do I stand out? Hey! What's going on here?"
Notwithstanding this, your spreadsheet solution appears ingenious. Of course, it presupposes having a spreadsheet to hand. Comparison of slope with sights is not dependent on any electronics, since the slope can be derived graphically.
The attached spreadsheet provides one way for averaging of sights. Observation times go into column A and are considered exact.
One of the ways apparent outliers are created is by the mis-recording of time. Its easy enough to do and just as likely to occur as writing down the incorrect altitude. I know this because I've done both, and have also been affected by this vice when using a scribe to record observation data. Since one number looks so like another this error may not be picked up during an averaging or linear-fit exercise. However, if you graph those sights and compare them with the calculated (= true) slope, then such outliers immediately jump out and loudly exclaim: "Hey, look at me! Why do I stand out? Hey! What's going on here?"


