NavList:
A Community Devoted to the Preservation and Practice of Celestial Navigation and Other Methods of Traditional Wayfinding
Re: On checking accuracy
From: Bill B
Date: 2008 Aug 10, 02:39 -0400
From: Bill B
Date: 2008 Aug 10, 02:39 -0400
Peter wrote

> Since slope analysis is all about drawing a picture, to assist the
> evaluation of a series of sights of the same body made over a short period
> of time, I thought it might be helpful to provide simple illustrations, not
> least to assist those who still have difficulty in appreciating how slope
> analysis tends to be superior to some form of averaging...

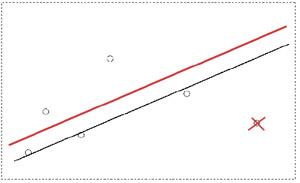
I had to smile looking at your final graphic, remembering a recent
experience.  I don't know your y scale, but I would tend to give some weight
to the observations above the line.  3 outliers out of 6 observations seems
a bit much.  Your line seems to have a greater affinity for the concept of
central tendency than the small n would warrant IMHO.

I would tend to slip the slope up as per the attached graphic.  And that's
what makes it a horse race ;-)

The recent experience?  Observations with an artificial horizon from a known
position.  I quickly compared the 6 observations with the actual Hc's,
calculated the mean of the errors and n-1 standard deviation. Whoa, the n-1
s was larger than half the range!  What happened?  As I looked for the
reason, I saw I had an equal number of observations 0!2 away and 0!2
towards, with nothing in between. A reminder that with that few
observations, I should not matter-of-factly expect a Gaussian distribution.

I feel, even though we are using the actual slope, if we simply say 3 out of
6 are on the line so that must be it; we fall into the same trap Burch
pointed out regarding best fit/linear regression.  In his example 3 out of 4
fit an arbitrary line, so the one off the line must be the outlier. Once the
actual slope was used we saw that what looked like the outlier was not.

My +/- 0!2 result was strange be sure, but if just on was off of 0!2, should
I then automatically snap the line to the 3 that lined up perfectly?

Bill B.


--~--~---------~--~----~------------~-------~--~----~
Navigation List archive: www.fer3.com/arc
To post, email NavList@fer3.com
To , email NavList-@fer3.com
-~----------~----~----~----~------~----~------~--~---


