NavList:
A Community Devoted to the Preservation and Practice of Celestial Navigation and Other Methods of Traditional Wayfinding
An example of a slope
From: Peter Fogg
Date: 2007 Mar 10, 13:52 +1100
From: Peter Fogg
Date: 2007 Mar 10, 13:52 +1100
Earlier I wrote, about comparing a pattern of sights taken of the same
body over a five minute period:
Comparing the slope is a kind of averaging, since with even random
errors the adopted line will bisect the negative and positive values.
I think having a graphical solution is intuitively more useful than
just a row of numbers - you can evaluate the sights made and shift the
line of best fit to suit the data by eye in a way that no mathematical
number crunching process can achieve quite as well. In effect you can
nominate the importance given each sight; how close to the adopted
line you allow it to sit, perhaps in accordance with your memory of
how clearly and how well you remember that sight being made, as well
as in light of how the other sights fit the line.

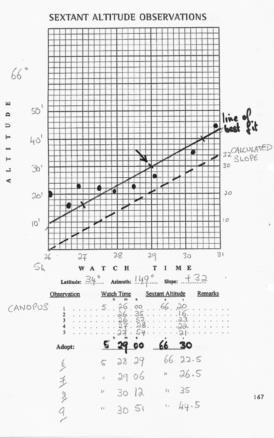
Attached is an example (worth a thousand words?) based on actual observations.

The body is Canopus, the latitude 34d, the azimuth 149d, leading to a
calculated slope of 32 minutes of arc over 5 minutes. Since the obs
are to the east the body is apparently rising - if looking to the west
the slope would descend from left to right.

On the form (from "The Complete On-Board Celestial Navigator" by
George Bennett) there are spaces for 5 sights, which is about how many
one unaided person can make over this period. I must have had someone
acting as scribe to manage nearly twice this number over the period.

The slope should not be extended beyond 5 minutes of time since the
body's apparent rise or fall actually describes an arc, not a straight
line. In any case the opportunity for taking sights may be limited
(eg; twilight), plus all sights comprising a fix need to be made
within a shortish time-frame on a moving object using the one DR, or
suffer the distorting effects of platform movement.

The calculated slope is the dotted line at the bottom, the adopted
line of best fit the solid line parallel to it. Any point along this
line can be adopted. I have chosen 5h 29m 00s / 66d 30' but could as
well have adopted 5h 27m 00s / 66d16', or 5h 30m 30s / 66d 40'
(indicated by crossing lines). All will lead to the same position line
via sight reduction.

Did I put the line in the right place? Who knows! Can you find a
better place for it, based on the sights? The first and third obs
don't seem to fit, so have been given little weight - essentially
judged to be outliers and discarded. The calculated slope is the fact
that the sights should match as best they can.

You can see how a process of averaging or linear regression would be
influenced by these dodgy sights - inevitably a different slope would
be generated. But the slope is a fact, it cannot be changed. If the
outliers were more extremely wrong (as they easily can be) and the
sights fewer, the unhelpful distortion via these inappropriate
techniques would be greater.

Hopefully this example shows how the adopted alt / time is an
improvement over any of the random sights, via a mix of science and
art; or to put this another way: via calculation, skill, experience,
intuition and good ole common sense. Don't leave home without it.

Alex wrote:
"In principle I agree that graphic methods are
better, especially to select the outliers.
But they are very time consuming. And prone to additional
blunders."

This goes to what I wrote earlier about how, in my judgement, it is
better to reduce random error before sight reduction than worry later
about the indeterminate nature of a fix based on random sights. In my
(ever so humble) opinion, the extra time and effort of analysing the
raw data of sights made, as shown here, is recompensed adequately by
the improved quality of the resulting position lines.

An alternative to this is to make many individual sights of different
bodies and reduce them all and then cope with all the resulting
position lines. I know which I prefer, and also which is quicker.

Like many others; these days when on-board there is usually at least
one GPS unit, so my quaint efforts with sextant, watch and forms serve
mostly to show up their errors compared to the electronic deity. But
it also means that I know that this comparison of slope consistently
produces a better position than any of the individual sights.

It really is a practical and easily-worked method of producing good
data from bad.

--~--~---------~--~----~------------~-------~--~----~
To post to this group, send email to NavList@fer3.com
To , send email to NavList-@fer3.com
-~----------~----~----~----~------~----~------~--~---


