NavList:
A Community Devoted to the Preservation and Practice of Celestial Navigation and Other Methods of Traditional Wayfinding
Re: Azimuth Angle and the Time Diagrams
From: Stan K
Date: 2015 Dec 30, 17:10 -0500
From: Stan K
Date: 2015 Dec 30, 17:10 -0500
Steve,
If you find meridian diagrams to be helpful, Celestial Tools will create a meridian diagram for any sight that is reduced with the Sight Reduction tool or SR Methods tool.
Also, there are two programs available on the ONCom web site that may be of interest:
1) Plottool: One of its functions is to draw a meridian diagram, and allows you to see what happens as any of the parameters is changed.
2) Navtra: Given any three of latitude, LHA, declination, altitude, and azimuth, will solve for the other two and draw the meridian diagram.
Stan
-----Original Message-----
From: Sean C <NoReply_SeanC@navlist.net>
To: slk1000 <slk1000@aol.com>
Sent: Wed, Dec 30, 2015 2:17 pm
Subject: [NavList] Re: Azimuth Angle and the Time Diagrams
Attached File:

(f1-Meridian.jpg: Open and save)
From: Sean C <NoReply_SeanC@navlist.net>
To: slk1000 <slk1000@aol.com>
Sent: Wed, Dec 30, 2015 2:17 pm
Subject: [NavList] Re: Azimuth Angle and the Time Diagrams
Steve,
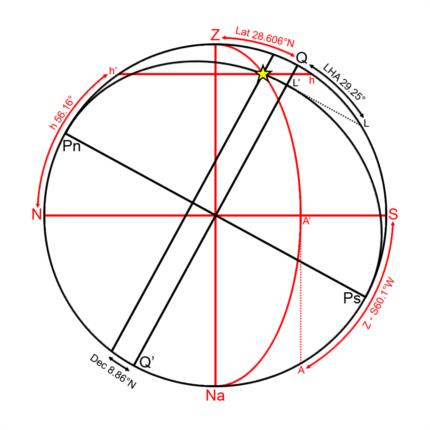
It just occurred to me that there is a 2D diagram which can help you visualize the relationships between latitude, LHA, declination, azimuth and altitude. Although, it's quite a bit more complicated than a time diagram. It's called a "diagram on the plane of the meridian", and I have attached an example using some of the values from your original post: latitude = 28.606°N; longitude = 80.84°W; GHA = 110.09° (LHA = 29.25°*); Dec. = 8.86°N**. This is the same type of diagram which can be found in the introduction of each volume of Pub 229 (Sight Reduction Tables for Marine Navigation), and which is explained in great detail in section 1528; chapter 15 of the 2002 ed. of Bowditch. (See the resources tab at the top of this page.)
In order to make sense of it, you must imagine the observer at the center of the diagram. North is to the left, South is to the right. The red N-S line is the horizon; below it is the ground, above it is the sky. (Looking at the diagram, you are located due west of the observer.) Point "Z" is the observer's zenith. "Na" is the nadir. The black outer circle is the observer's meridian. Point "Pn" is the north celestial pole and "Ps" is the south celestial pole. Line Pn-Ps is the Earth's axis. Line Q-Q' is the celestial equator. (Notice that the observer's zenith is 28.606° north of the equator; equal to the observer's latitude.) The straight black line to the left of Q-Q' represents the star's declination. It is 8.86° above the celestial equator. (Both line Q-Q' and the declination line are actually circles viewed edge on; the same with lines N-S and h-h'.) The black arc which runs from point "Pn", through the star and on to point "Ps" represents the star's LHA. Think of it as a half-circle that's swinging toward you (to the west) from the meridian, and so it appears as an ellipse. (At an LHA of 90°, it would be aligned with line Pn-Ps, and would appear as a straight line.) Its angle is measured from point "Q" to point "L"; construction line L-L' is tangent to the edge of the arc. Together, the declination line and LHA arc locate the star, both on the celestial sphere and in the sky of the observer; just like in reality. Line h-h' represents the altitude (height) of the star above the observer's horizon. Its angle is measured up from line N-S. The red arc which runs from point "Z", through the star and on to point "Na" represents the azimuth of the star. Like the black arc, think of it as a half-circle which is swinging toward you (again to the west). Its angle is measured from point "S" to point "A". Line A-A' is tangent to the edge of the arc. Now, if you were to measure the angle from point "N" to point "A", you would find it is 119.9° (180°-60.1°), the azimuth angle from your example. Either way, the true azimuth works out to 240.1°.
The meridian diagram can actually be used to graphically solve a sight reduction problem for a rough altitude and azimuth, given latitude, declination and LHA. The precision depends upon the size of the diagram. (In order to achieve the precision necessary for actual navigation, a huge diagram would need to be constructed. Not very practical.) It can also be used to predict the times of twilights and of the rising, setting and meridian passage of celestial bodies. Although, with today's technology, it is far easier, faster and more accurate to punch some numbers into a calculator or computer program; or even to use some form of tabular sight reduction. Anyway, I hope you will find this information useful...or at least mildly interesting. :)
Cheers,
Sean C.
*In your original post, you had the LHA listed as 240.1°. I suspect this was a simple "typo", substituting azimuth for LHA.
**I deduced a declination of 8.86°N based on the given GHA, declination, latitude, longitude and azimuth.
Attached File:

(f1-Meridian.jpg: Open and save)


