NavList:
A Community Devoted to the Preservation and Practice of Celestial Navigation and Other Methods of Traditional Wayfinding
From: Sean C
Date: 2018 Jan 4, 22:15 -0800
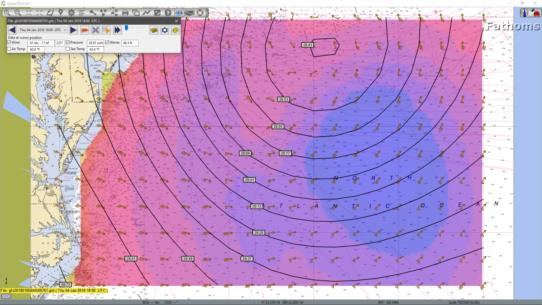
Attached is a screenshot of a GRIB I received from Saildocs at about 11:45 pm on Jan. 4th. I have it displayed in OpenCPN. It shows the winter storm currently battering the eastern U.S. The black rings delineate areas of differing pressure. The colors represent areas of different wave heights. The arrows represent wind speed and direction, of course. The pressure lines make the center of the storm clearly visible. The date and time are visible in the dialogue box in the upper left corner.
Also visible in the dialogue box are the conditions that were predicted for that time at my cursor's location. Although my cursor is not visible in the screenshot, it was in the vicinity of the wind arrow above the "R" in the word "NORTH" in the blue area. (Exact coordinates are at the bottom center of the screenshot.) I'm not sure how accurate all of these values are, but if they're even close ... holy cow! 61 kt winds and 46 ft waves?! I'd hate to be out in the middle of that mess. I pray that any poor souls who are/were make it through unscathed.
As for me: I've got about six inches of snow in my yard, plenty of food in the cupboards and the central heat is keeping me and my wife nice and toasty (so far). Towards the left edge of the image, you might be able to make out a small bullseye which marks the location of my house on the southernmost peninsula in Virginia. I'm off from work tomorrow and I've got no reason to leave the house. I hope all of you are doing at least as well. And if you do have to go out in the storm, please be careful.
Best wishes,
Sean C.


