NavList:
A Community Devoted to the Preservation and Practice of Celestial Navigation and Other Methods of Traditional Wayfinding
From: Frank Reed
Date: 2020 Jan 12, 16:20 -0800
You asked:
"My question is: does Sun altitude as a function of time describe a parabola? Or another curve? Or it doesn't matter as long as the fit is acceptable?"
Anything you can observe or calculate that reaches a maximum value and then falls away again can be fitted by a quadratic approximation over some interval of the independent variable. So yes, a parabola is acceptable over some range. How big is the range? Well that depends.
Suppose you're observing near the equator on one of the equinoxes. The Sun will rise at a constant rate, almost exactly 15° per hour for the six hours before noon. After noon it will fall at the same nearly constant rate. And for just a few dozen seconds (depending on details) right near local noon, the Sun's motion will flip. If you plot this out, you'll get a straight line before noon, a little curved segment near noon (which won't even be visible if you're taking sights every two minutes), and a straight line after noon. But if you took a sight every five seconds (maybe your have six observers shooting in a timed fashion shooting the Sun in sequence), you would find a little parabolic curve for about a minute right around noon.
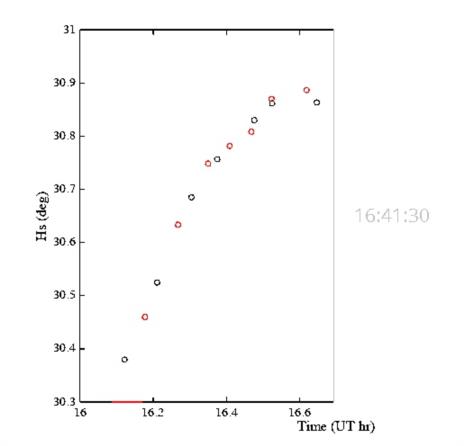
Notice that even in this case where the Sun rises straight up and falls straight down with a possibly unobserved parabolic curve at the top, the graph that you get still has a couple of things in common with a true parabola. It has a maximum point. We use that for latitude. And it has an axis of symmetry. So rather than fitting a curve, which is only an approximation anyway, you should look for methods that can read off that peak altitude and the axis of symmetry regardless of the actual shape of the curve before and after noon. A method which I have taught for many years is to plot the points on transparent or thin paper and then fold. You overlap the before and after points. When the before noon points and the after noon points most nearly line up, you have found your axis of symmetry.
In the modification of your graph below, I have plotted the afternoon points in red (I just took your graph and mirrored it). The after points align with the before points at just about 16:41:30 UT (which is odd! ...but we'll get to that in a minute). Notice that this is almost a pefect match for your parabolic fit within a couple of seconds. Advantage? You don't need any computation to find that axis of symmetry. And also, you will have some sense in the uncertainty of it all as you're deciding just where the before and after points line up. I wouldn't trust this time to better than twenty seconds. It's just a coincidence that it matches the fitting analysis within two seconds. In terms of longitude, every four seconds is one minute of arc of longitude, so if the UT of the axis of symmetry might shift up or down by twenty seconds, then the longitude could shift up or down by 5'.
The time of the axis of symmetry, though, is odd. It wouldn't work out at all if you took these sights within the past week. You would be well off-shore. Ah, but we can turn this around. You told us you took the sights in Belmar, NJ. The longitude would be consistent if you had taken this set of sights around November 18. Could that have been the case? I suppose that's more or less consistent with the maximum noon altitude, too.
Frank Reed
Clockwork Mapping / ReedNavigation.com
Conanicut Island USA


