NavList:
A Community Devoted to the Preservation and Practice of Celestial Navigation and Other Methods of Traditional Wayfinding
Re: Flight 19 route
From: Gary LaPook
Date: 2009 Sep 23, 02:05 -0700
From: Gary LaPook
Date: 2009 Sep 23, 02:05 -0700
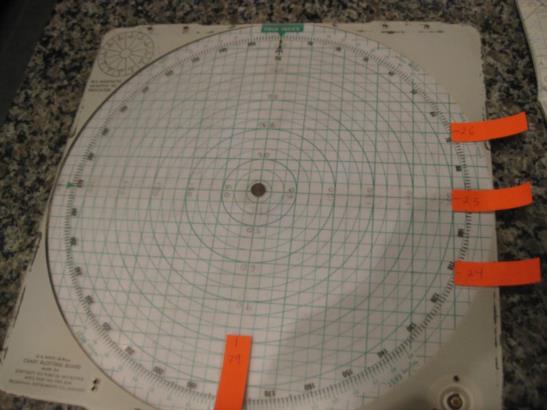
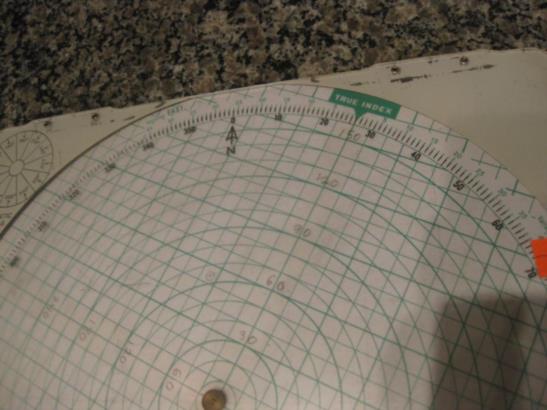
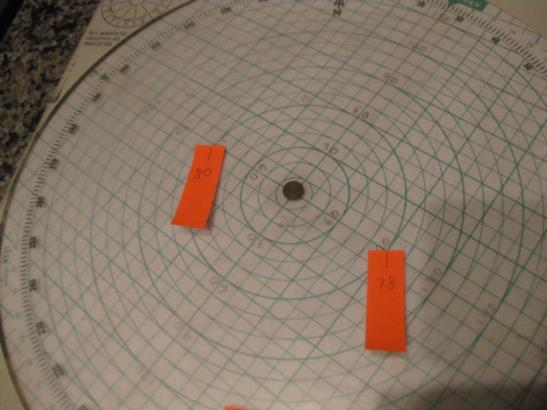
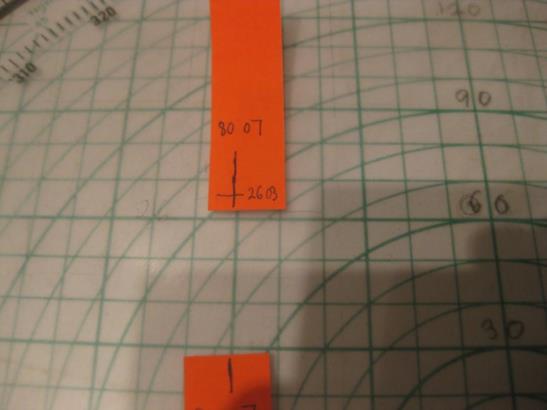
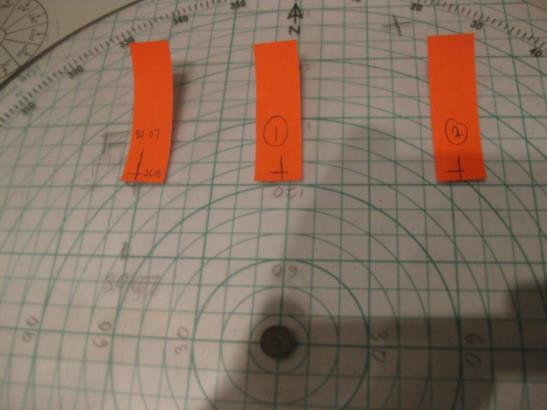
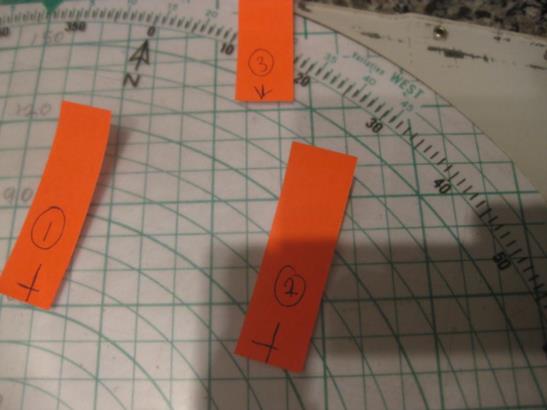
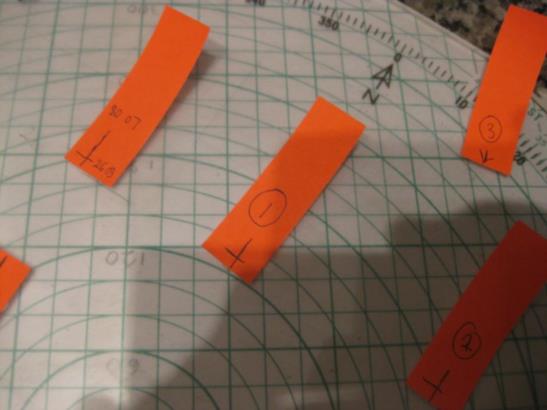
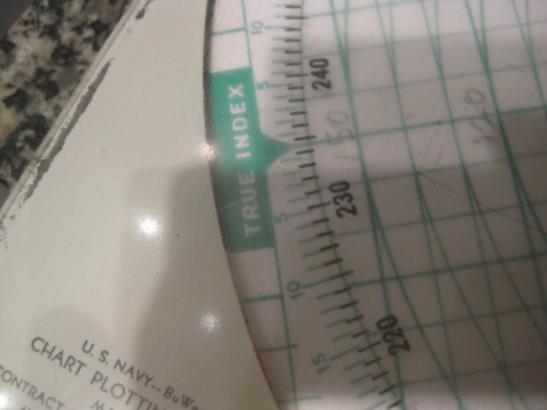
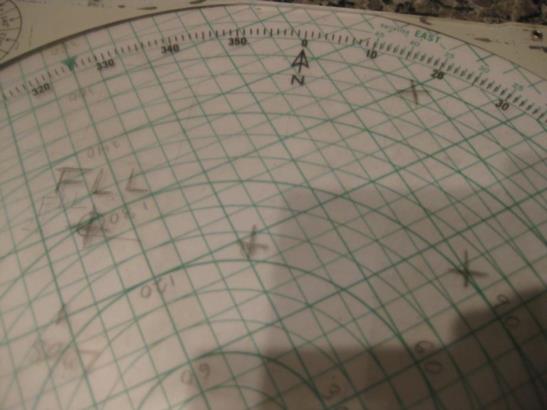
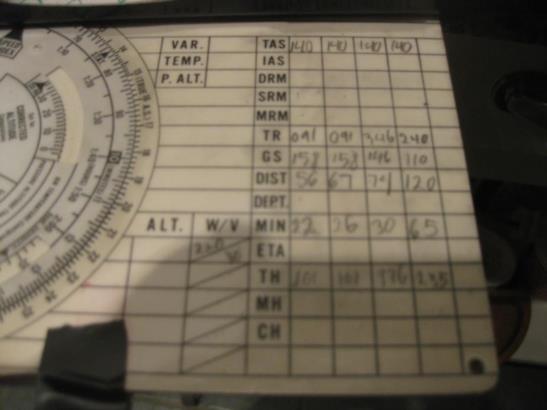
Of course, the student pilots in the planes would not have had a sectional chart or any chart at all! Since carrier based pilots fly over nothing but blue and any chart they would have would only be a blank blue sheet they use a Mk 6A plotting board instead. This plotting board allows the pilot to plot his courses, do wind correction problems and calculate the all important intercept back to his boat. I am attaching several photos showing how the Flight 19 nav problem would have been plotted. Photo 3449 shows the Mk 6A board. It has a clear plotting surface with a rotating grid under it mounted on a central pivot which is used to lay off the courses and to plot positions, plot celestial fixes and to do the other computations. Basically it allows you to quickly make the equivalent of the standard plotting sheet. So, just like setting up a plotting sheet we first label the central meridian and central parallel. I have chosen to use 25� north and 79� west to move Ft. Lauderdale (FLL) away from the central pivot. You set the rotating grid so that the "TRUE INDEX" is set to zero and label the central meridian and central parallel in pencil. To make it easier to see, I have placed orange stickers on which to make these labels. I have marked my rotating grid so that each line is spaced by ten nm. (I have also placed another set of markings, doubling the distances. We will use the ten nm spacing.) So we mark the central meridian, 79� W, and the central parallel, 25� N, Then moving up and down 60 nm we label 26� N and 24� N. (Photo 3455) In order to place meridians we use the same technique as with the standard "Universal Plotting Sheets." We rotate the TRUE INDEX to the central latitude, 25�, (Photo 3456) and this places a grid line running through the central pivot from 295� to 115� at an angle to the central parallel of 25� degrees. Then going out 60 nm along this central line we place a vertical mark representing the spacings of the meridians and mark 80� W and 78� W. If we wanted to we could then rotate the grid back to zero and then by following the grid lines we could draw in the meridians like on a plotting sheet but this is not usually done as they are not necessary. (Photo 3457) We need to plot the starting position, 26� 03'N, 80� 07'W. With the TRUE INDEX still set on 26� we go out to the northwest on the same grid line 67 nm since 80� 07' W is 67 minutes west of the 79� W central meridian and make a vertical tick mark. (Photo 3458) Then rotate the grid back to zero and extend this line up, parallel to a grid line, to cross a line that you estimate 3 nm north of the 26� N line marking the starting position. (Photo 3459) Next we turn the TRUE INDEX to 91� .(Photo 3461) Then, moving parallel to the grid line and counting 56 nm from the starting position you mark the first position and 67 nm further along you mark the second position. (Photo 3482) Next set the TRUE INDEX to 346�. (Photo 3462) Then moving parallel to the grid lines count 73 nm from position 2 and mark position 3. (Photo 2463) Now turn the grid so that it runs from position three to the starting position (Photo 3465) and read at the TRUE INDEX the course back to FLL, 235�, not 241�. (Photo 3464) Count the grid lines and determine the distance from position 3 to FLL is 126 nm. Photo 3469 shows how the plot would have actually looked. The Mk 6A also has a pull-out computer to do time-speed- distance computations and a table where this information can be kept. (Photo 3474) gl --~--~---------~--~----~------------~-------~--~----~ NavList message boards: www.fer3.com/arc Or post by email to: NavList@fer3.com To , email NavList-@fer3.com -~----------~----~----~----~------~----~------~--~---

