NavList:
A Community Devoted to the Preservation and Practice of Celestial Navigation and Other Methods of Traditional Wayfinding
From: Robin Stuart
Date: 2010 Jun 7, 16:18 -0700
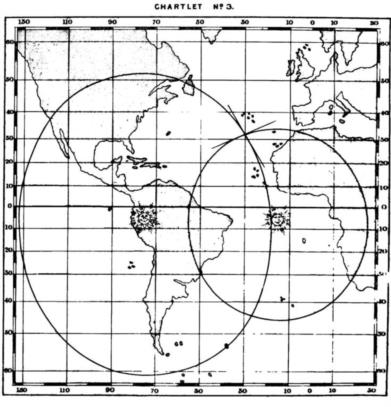
In my talk at the 5 June Navigation Weekend at Mystic I showed, as an aside, how position could be determined from a double altitude sight by purely graphical (ruler and compass) methods with a stereographic projection chart. The problem considered was taken from Lecky, S. T. S., "Wrinkles" in Practical Navigation, George Philip & Son, Liverpool, 1886;
http://books.google.com/books?id=dmbOAAAAMAAJ
and involves two observations of the Sun roughly 4 hours apart. The relevant values for Greenwich Hour Angle (GHA), declination (dec) and zenithal distance (ZD) of the Sun are
GHA1 = 0h59m59.10s dec1 = -4 59'19.9" ZD1 = 40 00m00.0s
GHA2 = 4h59m58.97s dec2 = -4 55'26.0" ZD2 = 56 43m15.0s
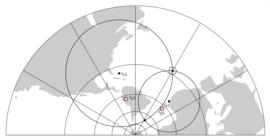
The solution is shown under the usual Mercator projection in Lecky's chartlet (attached). The circles of positions (CoP's) on the chartlet are, of course, not circles or any convenient shape for that matter. The same problem is shown using stereographic projection with the Geographic Position (GP) of the Sun at the 2 observations being labelled zp1 and zp2. Note that the CoP's remain circles on this chart but their centres are not at zp1, zp2. The actual locations of the centres, labeled zc1 and zc2, and the radii of the circles can be found graphically and the observer's location immediately follows.
The centre and radius of each circle on the chart can be found as described below:
1) Locate the vertices (farthest North and South points) of the circle. These have the same longitude as the GP of the Sun and latitude (dec + ZD) and (dec - ZD). For the first circle the vertices are at
35 00'40.1"N 14 59'46.5W (0h59m59.10s)
44 59'19.9"S 14 59'46.5W (0h59m59.10s)
Plot these points on the chart and draw a line between them.
2) Use ruler and compass to locate the midpoint of the line (a standard trick that every school pupil learns) and hence find the centre of the circle.
3) Set the compass using the distance between the center and the vertex.
4) Draw the circle
Accuracy is limited by the scale of the chart but for this particular problem if we assume a chart of 100cm in height (radius), a 1mm plotting error corresponds to about 5 n.m. error in position. In certain situations, e.g. for sights too far off the zenith, the CoP's may become too large in stereographic projection to be drawn and render the method impractical.
Has anyone seen this approach referred to or used?
Robin Stuart
----------------------------------------------------------------
NavList message boards and member settings: www.navlist.net/NavList
Members may optionally receive posts by email.
To cancel email delivery, send a message to NoMail[at]navlist.net
----------------------------------------------------------------


