NavList:
A Community Devoted to the Preservation and Practice of Celestial Navigation and Other Methods of Traditional Wayfinding
From: Modris Fersters
Date: 2020 Dec 25, 11:07 -0800
Hello, Frank!
You wrote: Back to the photo that started this, if you're game, Modris, I'm still interested in the issue of the sensitivity of the navigational "fix" in this analysis. Throwing away the lighthouse and other non-astronomical clues, what is the possible range of positions, dates, and times that would work for this photo given reasonable limitations on our ability to determine celestial coordinates from the photo? And in this case, yes, we can limit ourselves to December 2020. :)
OK, let’s analyse the probable errors in this “picture puzzle”.
1) Date.
If I were unsure of sky region, but December 2020 would be “given” as start position, I would inspect in Stellarium about 2…3 days old Moon position against the star background. Therefore the date won’t be a problem. It is only a question of patience. The number of bright stars and planets are not so large. Therefore it is possible to identify the sky region to correspond the picture. Besides picture is not full of hundreds or thousands of stars, but enough to identify the region. And that facilitate the task.
2)Time.
The time can be quite precisely deduced from Moons position against Star 52Sgr. That star lays just in the track of the Moon. The direction toward Saturn and Jupiters allows to confirm that Lunar distance would be good enough to calculate the time.
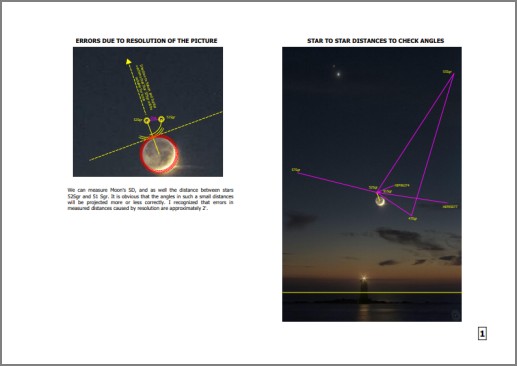
First of all I measured the small angles around the Moon: Moons diameter, distances between stars 51Sgr and 52Sgr; and between 52Sgr and HIP96274. From these I derived value of one length unit in picture.
As the reference object for LD is so close to the Moon I think that we can assume that the angles in such a small region on the photo are projected correctly. The precision of LD measurments were limited by resolution of the picture. I measured that the LD can be dependent on within about 2’.
From LD, and altitudes of both bodies I calculated the time: 17:12:43. If we assume LD error 2’, the time limits would be from 17:05:48 to 17:19:35. But if we additionally take into consideration probable altitude errors of +/-30’ the time range will expande insignificantly to 17:04:00….17:20:00. Lets assume the average value 17:12:00 and those limits mentioned above.
3) Precision of the angles.
To check the possible error while measuring the angles from picture, I calculated 7 different distances between 7 star pairs. The results showed that the error can accumulate same 15-20’ on angles of about 8 degrees. Therefore for altitude calculations I assumed the error even larger: 30’.
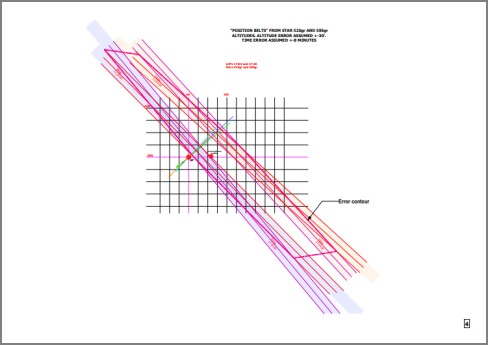
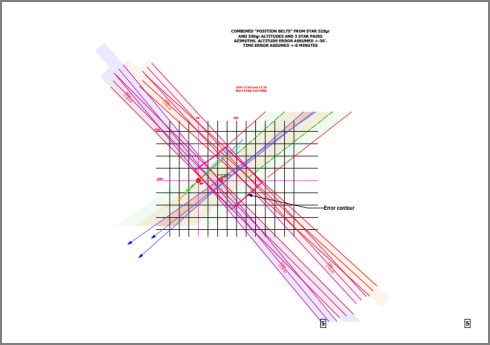
4) I constructed position lines for 2 star fix in two different times: 17:04:00 and 17:20:00. Each position line from star altitude I draw like a belt with width of 60’ (that is assumed altitude error +/-30’). The polygon obtained shows the area of probable position.
5) How to narrow down the borders of probable position polygon?
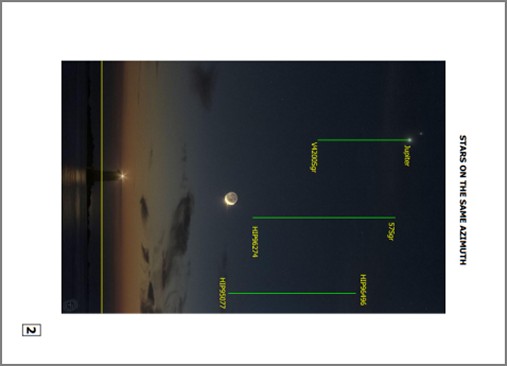
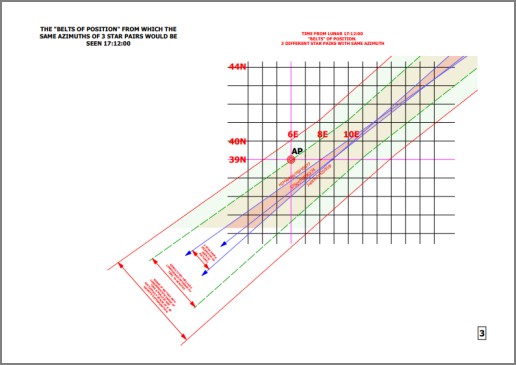
I decided to use the fact that we can find several star pairs which are projected on the same vertical (for 57Sgr star I measured shift 5’ in picture). It means that the pairs of stars have equal azimuth. I choosed 3 star pairs (see picture). And I calculated from assumed position 39N (that is rounded value from my previous calculations) the longitude from which the star pairs have identical azimuth angles. I simply used online sight reduction calculator, opened it in two tabs so that two calculators are available at once, then I entered GHA and dekl values for both stars in star pair. By some iterations I found the corresponding longitude. Then I drew azimuth lines throug that points.
I took into consideration the time range (+/- 8 minutes of time), therefore I expanded the lines as a belt. Then I added probable error of 5’ as horizontal shift error (I assumed that two points in picture, that are on same vertical can be in fact be shifted horizontally on spherical surface).
I checked the change of azimuth if assumed latitude would be 4 degrees grater. The result was a little bit shifted, but insignificantly. I did not start to complicate my drawings, because I dont expect accuracy more than some degrees.
6) Results.
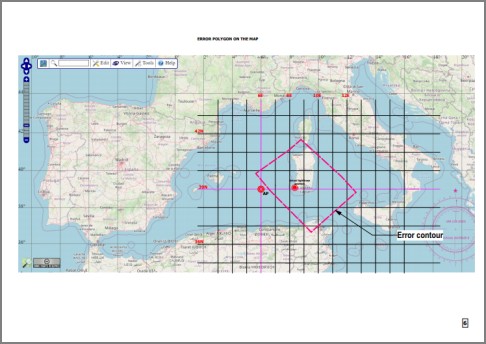
The resulting error polygon is shown in pictures. Of course these results are approximate (no one is expecting extra accuracy of minutes of arc). But they show the tendency.
Interesting that azimuth lines without any corrections lays very close the actual position of the lighthouse:)
Modris
