NavList:
A Community Devoted to the Preservation and Practice of Celestial Navigation and Other Methods of Traditional Wayfinding
From: Frank Reed
Date: 2021 Dec 23, 12:39 -0800
David Pike, you wrote:
"Not being into pixel counting, I identified the zenith by drawing arcs from the four corners of the rim which are visible like finding the centre of a round bar with odd legged callipers. My result was very close to your zenith. In fact, you wouldn’t go far wrong simply drawing diagonals from opposite corners of the photograph."
Yes, crossing diagonals produces exactly the same result since the point that I suggested as the zenith is simply the middle of the image by pixels. But I should emphasize that this is just an assumption. I assume that the all-sky camera has been levelled with some attention, but at the same time, this camera is mostly for entertainment so the mid-point zenith could easily be off by a degree or several. In fact, that seems to be implied by the fix that I get...
As I said in earlier posts, we have three altitudes that we can use for a fix. The stars Betelgeuse, Sirius, and Miaplacidus appear to be at nearly the same altitude, so we can get by without an absolute altitude scale. Further, using Orion's Belt for a relative scale (which should be fair since it's only a little higher in altitude than those three bright stars), we can see that Betelgeuse is about 1° lower than Sirius and Miaplacidus is about 1° higher than Sirius. So we can do standard three-body fixes using triples of altitudes, like 10°,11°,12° for those three stars, or more generally 10+x, 11+x, 12+x where we cycle through various values of x. These will all give fixes of a sort but the triangle or "cocked hat" will be rather large except for the right value of x.
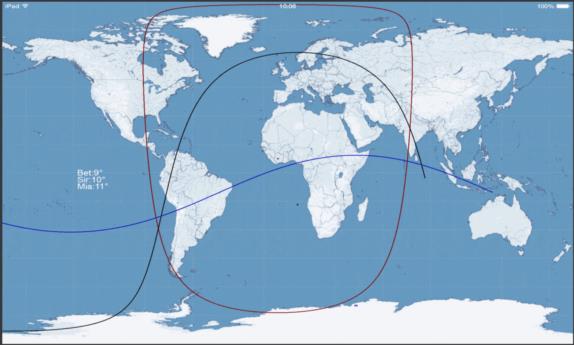
I posted an animation of this process previously, but I decided to make another today to illustrate the idea. We assume that the UT is known so I can plot the subStar points for each of the three stars. Those points are visible as small dots in this animation. Then for each altitude there is a corresponding circle of position. The circles do not look circular in this animation because they have been drawn on a simple rectangular map projection. The animation cycles through various values for the possible altitudes and then loops back. The COP and subStar point for Betelgeuse is dark red, Sirius is black, and Miaplacidus is dark blue.
All of this could be done with paper and pencil. We could just plot various standard three-star fixes, again cycling through values of the altitude offset "x" as described, and look for the one that gives the tightest fix (the smallest "cocked hat"). This process is identical to determining an unknown systematic error (e.g. unknown dip) in a multi-body sight.
It seems clear from the animation that the best fix, based purely on the astronomical data and the assumptions we made analyzing the image, implies a location on the coast of Chile or even slightly offshore. We know from simple internet searching that the image was generated inland in Chile at the observatory complex at La Silla. Why doesn't it match better? My guess is that the assumed zenith in the image is not correct. Rather than the exact center of the image, the true zenith is a degree or two to one side of the center. It's also possible that the timestamp is in error, or some combination of these causes.
Note: the attached image here is an animated GIF. After you click on the preview to get to the full image, most browsers will display the animation. If it does not "play" for you (appearing as a single static image), then visit this link for an MP4 video version of the same animation: https://vimeo.com/659761890.
Frank Reed


