NavList:
A Community Devoted to the Preservation and Practice of Celestial Navigation and Other Methods of Traditional Wayfinding
From: Sean C
Date: 2018 Feb 18, 18:56 -0800
Paul Hirose wrote:
"I believe latitudes from the program are equally probable in the intervals [0, 10] and [80, 90]. If that's true, the density of the random points increases from the equator to the pole. That may be undesirable for generating sight reduction practice problems, or data for a Monte Carlo experiment."
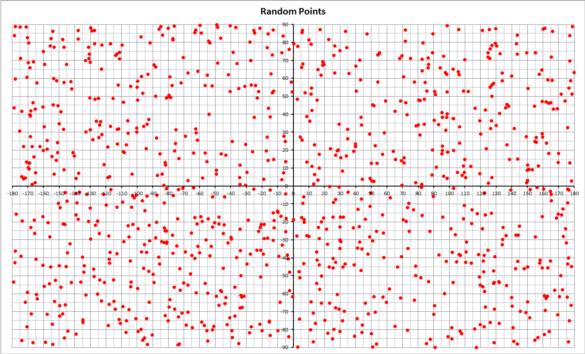
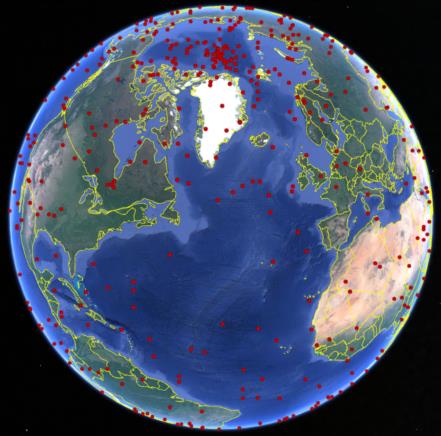
I didn't quite understand why the density should increase toward the poles, so I decided to try and visualize the problem. I graphed 1,000 "random" points in excel. (See first attached image.) They seemed pretty evenly distributed to me. That is ... until I realized that I was essentially looking at an equirectangular projection. When wrapped onto a globe, the higher latitude points would be condensed due to the decreased spacing in longitude. When the same points are mapped in Google Earth (see second attached image), the problem becomes quite apparent. Compare the number of points near the North Pole with those in the Atlantic Ocean.
Is that right?
-Sean C.


