NavList:
A Community Devoted to the Preservation and Practice of Celestial Navigation and Other Methods of Traditional Wayfinding
Re: Scale a small area plotting sheet?
From: Gary LaPook
Date: 2016 Feb 29, 08:19 +0000
From: Gary LaPook
Date: 2016 Feb 29, 08:19 +0000
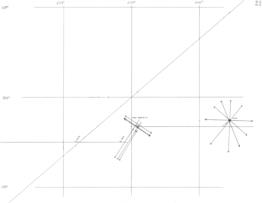
But there is no reason to draw in the latitude and longitude graticule just the two lines that cross in the center and the diagonal line for measuring longitude.
From: Sean C <NoReply_SeanC@fer3.com>
To: garylapook@pacbell.net
Sent: Sunday, February 28, 2016 4:38 PM
Subject: [NavList] Re: Scale a small area plotting sheet?
Attached File:

(Homemade_Plot_Sheet.jpg: Open and save)
Attached File:

(plot-sheet.gif: Open and save)
This is all you need for plotting APs, and positions and to take out the coordinates of a fix.That is how it is done on the Mk6 plotting board used in naval aircraft. Those additional latitude and longitudes llines add nothing, they are only useful if you have a need to believe you are looking at an official chart.
gl
From: Sean C <NoReply_SeanC@fer3.com>
To: garylapook@pacbell.net
Sent: Sunday, February 28, 2016 4:38 PM
Subject: [NavList] Re: Scale a small area plotting sheet?
Steve,
You wrote:
Perhaps one day I will figure out how you are so adept at creating a plotting sheet as nice and neat as you do.
I used Adobe Photoshop CS3 to make those examples. It's my goto program any time I want to make nice looking computer graphics. However, at a cost of around $1,000, I doubt it's worth purchasing just to make a plot sheet now and then. :) The same could probably be done with a much less expensive (or even free) program. I've heard that a program called GNU Image Manipulation Program (GIMP) is comparable to Photoshop - and it's free!
Truth be told, when I make my own plot sheets I use a blank piece of paper, ruler, pencil, protractor and a parallel rule. Often, they're not as precise as I'd like them to be, but they work just fine. Attached is an example I made to plot fixes from problems 14-2 & 14-3 from the book "100 Problems in Celestial Navigation". Almost all of the fixes I've plotted on these sheets are within 1nm of the book's answers. Any deviation is probably due to my selection of the actual fix position by "eyeballing" it. I usually use a scale of 1/16th in. = 1nm. That makes it easy to use a common ruler to measure out minutes of latitude and longitude. As you can see, I don't even mark the minutes on the sheet. I measure out distances I need with the ruler and make little hash marks directly on the latitude lines and longitude diagonal. I masure the position of the fix and write it on a separate sheet of paper which also has all my sight reduction calculations on it.
Also attached is an animation in the form of a .gif that I recently made (with Photoshop). It explains, step by step, how to make just such a plot sheet. Let me know what you think. Is it confusing? Too fast/slow? I always welcome suggestions to improve my animations and graphics.
Cheers,
Sean C.
Attached File:

(Homemade_Plot_Sheet.jpg: Open and save)
Attached File:

(plot-sheet.gif: Open and save)


