NavList:
A Community Devoted to the Preservation and Practice of Celestial Navigation and Other Methods of Traditional Wayfinding
From: Frank Reed
Date: 2016 Dec 26, 16:38 -0800
David Pike, you wrote:
"In fact, my chartlet, which I’m working on at the moment for the astrovan, i.e. restricted to Lincolnshire, will look like a Mercator chart, work like a Mercator chart, but unfortunately won’t smell like a Mercator chart."
There's also no reason why it would actually be a Mercator chart. You absolutely do not need a Mercator chart to plot your intercepts and lines of position. All you need is a conformal plot which you can get from nearly any map-making tool, including, for example, Google Maps.
You added:
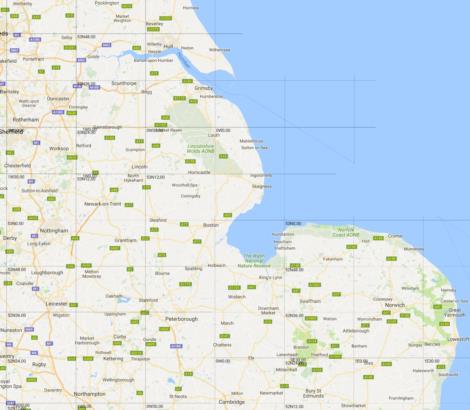
"I want to be able to demonstrate the intercept method. So I need to be able to plot the kind of assumed positions necessary to use AP3270/HO249. That is, a whole degree of latitude and minutes of longitude to make a whole degree of LHA. I also want to include the outline shape of Lincolnshire, so that observers can get an idea just how accurate (or inaccurate) celestial can be. Therefore, I need a latitude line, 53N, and a longitude scale from about 0001.30W to 000.30E."
This is relatively straight-forward, though perhaps not "easy". Google Maps does not ordinarily include a lat/lon grid. It's available in the API (the programmable version of Google Maps), and here's a demo that will do just that: http://www.bdcc.co.uk/Gmaps/ll_grat_v3_demo.htm. You'll have to play around with it a bit to get what you want, but I'm including an image, below, of a detailed example that I hope is fairly close to what you requested. Maybe good enough?
Note that the image is over 1800 pixels wide by 1600 pixels tall so be sure to zoom in to see it all.
Frank Reed
Clockwork Mapping / ReedNavigation.com
Conanicut Island USA


