NavList:
A Community Devoted to the Preservation and Practice of Celestial Navigation and Other Methods of Traditional Wayfinding
From: Frank Reed
Date: 2017 Feb 25, 12:47 -0800
Greg Rudzinski, you wrote:
"To further complicate the triangle center- what happens to the triangle center when we attach a confidence value to each individual LOP ? I call this a 'calling the shot percentage'."
There's a simple way of dealing with that, but naturally it takes you outside the easy geometry of a triangle since you no longer have three identically-valued lines. First, decide how much quality-control you need. You call the shot and assign it a weight... How many weights can you realistically apply? Maybe a scale of 1 to 3 is enough. Extending to a larger 1-to-5 scale is not more difficult in principle.
A little side-story... Last night I stepped out of my car in Cambridge, Massachusetts in the early evening and had a strange "global warming" moment. It was about 65 degrees (F) outside, very comfortable "shirt-sleeve" weather. The air smelled a bit of Spring... I could imagine winter is over, but I knew very well that this was February 24. And there on the meridian was the constellation Orion. Orion! Orion on the meridian in the early evening in pleasant warm weather!! What hemisphere is this?!
Standing in Cambridge, on a balmy February evening... after shooting the Orion North Arrow with my hand to remind myself which way I was facing, I took a moment to contemplate a three-star round of sights. This location, just north of Boston, is severely impacted by light pollution, but I could could see down to nearly third magnitude, so there were many options. I decided I would shoot Venus, Betelgeuse, and Pollux. If I had taken sights, I could imagine being happy with my Venus sight since there was still a bright horizon below it. I would assign it a 3. Then Betelgeuse and Pollux with less distinct horizons might be weighted each as a 2. Combining these sights with weights is actually easy (I think): just treat each sight as multiple lines of position. With these weights, you have, in effect, three sights of Venus with identical parameters and two sights each of Betelgeuse and Pollux. You could do the least squares math, as found in any modern Nautical Almanac, if you want, but you can also make an excellent guess how the fix will be modified: plot the symmedian point for three sights as normal and then nudge it directly towards the Venus line of position. If instead you have two sights with "3" ratings and one with a "2" rating, then you do the normal plot and nudge away from the third LOP (directly away, perpendicularly from that lower-rated sight). With a little practice, training your neural network with sample weighted cases, you could readily develop excellent skills estimating the right amount of "nudging" for general cases without explicit calculation.
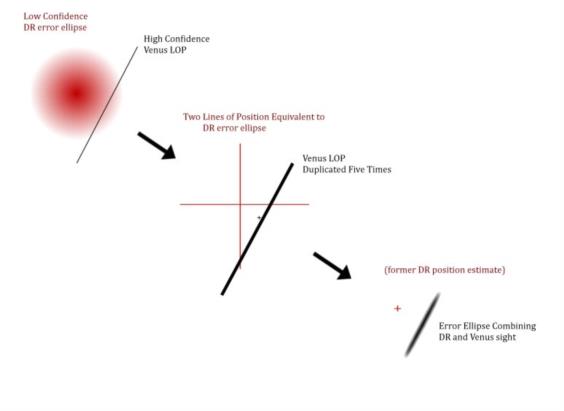
Another interesting application of this: Suppose you have one sight of Venus with roughly +/- 1 nautical mile confidence. And you also have a DR position with approximately a 5 mile estimated error circle on it. How can you combine those with reasonable mathematical rigor? Well, the error circle for your DR position doesn't "care" where it came from, so just treat it as the result of two perpendicularly crossed LOPs with low confidence (specific rules to be determined). You might give those arbitrary LOPs weights of 1 while your Venus LOP has a weight of 5. In plotting terms, you would hae one LOP each to produce the DR error circle, and then 5 identical Venus LOPs to show the higher weight of the celestial sight. You combine all 7 LOPs using the usual math to yield both a best and also an error ellipse that combines all available data in a mathematically reasonable way. I'm including an image that I hope illustrates what I am describing here.
Frank Reed


