NavList:
A Community Devoted to the Preservation and Practice of Celestial Navigation and Other Methods of Traditional Wayfinding
From: Gary LaPook
Date: 2011 May 5, 02:54 -0700
(I am also attaching a PDF copy of this post to preserve formatting and special characters.)
Last Sunday, May 1, 2011, my wife and I and another pilot and his wife flew out to Catalina
Island for the buffalo burgers that they have at the airport restaurant. (There is a large herd of
buffalos living on Catalina and they are routinely turned into buffalo burgers.) .) We landed at the
“airport in the sky” which is 1600 feet above the sea and is on top of a mesa with drop offs at
each end of the 3,000 foot long runway. If you have seen the 1994 movie staring Diane Keaton
“Amelia Earhart: The Final Flight” then you have seen this airport since it was used as the stand-
in for the Lae airport.
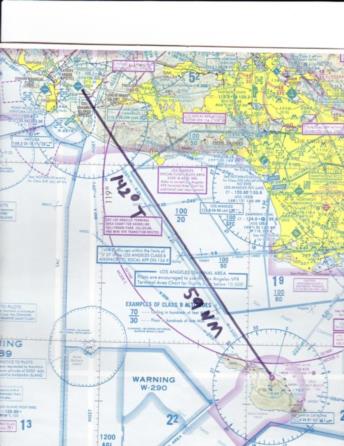
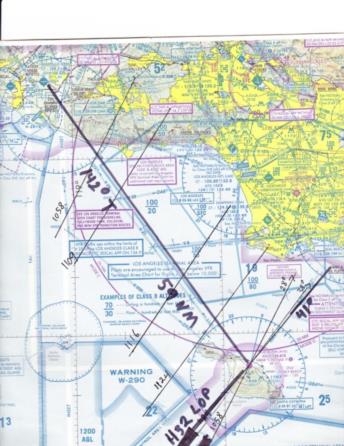
Attached as Chart 1 is the aeronautical chart showing the course from the Camarillo airport to the
Catalina airport. The true course is 142̊ and the distance is 59 nautical miles.
Since I would have another pilot along to handle the controls, I decided to take this opportunity
to take some sun sights with my A-7 bubble sextant to investigate how difficult it would have
been for Fred Noonan to take similar sights as they approached Howland Island on July 2, 1937.
Because the random movements of the plane in flight makes the bubble (being used for the
establishment of a level reference point inside the sextant) move around, the measurement of the
height of the sun (or star) varies around the correct value. Because of this, a flight navigator must
take a series of sights and then average them to find an accurate height of the sun, measured in
degrees and minutes of arc (1/60th of a degree) and Noonan had to do this by hand. I have taken
other sights in flight with my A-7 sextant but I have used the averager incorporated in this
improved model of the Pioneer instrument being used by Noonan that didn’t have an averager.
For photos of this bubble sextant see:
https://sites.google.com/site/fredienoonan/topics/pionneer-octant
The way these bubble sextants are used is that you look though the eyepiece and you see the
circular bubble in the center of the field of view and you also see the sun in the field of view.
You then turn an adjustment knob that moves the altitude scale and makes the image of the sun
move up and down. You adjust the knob until the sun is level and next to the bubble and then
your read the altitude off the scale. This is a little more difficult than this sounds because the
bubble is in constant motion due to the random accelerations of the plane. The averager on the A-
7 is a simple device that holds a pencil. When you have brought the sun level with the bubble
you push a lever and the pencil makes a mark on the altitude adjustment knob. By lining the
pencil up with the mark on the adjustment knob you will automatically be lining the scale up
with the index showing the altitude of the sun at the time you pressed the lever. You take a series
of shots, pressing the lever each time you line the sun up with the bubble. After you have taken
enough shots you then look at the series of pencil marks on the knob, estimate the center
(median) of the marks and line up this center with the pencil and then read the scale which
represents the average, or median, of all the shots. Similar averagers were used on many WW 2
sextants including the A-10 and the A-12. Noonan, however, would have had to line up the sun
with the bubble, read the scale, write down the reading and then take another sight. To get a
reliable average you want to take about 10 shots so this can take some time. When using the
averager it takes me about two minutes to take ten shots. Using the sextant for manual averaging
my procedure was to line up the sun with the bubble, look at my watch and write down the
starting time of the series of shots. I then read the altitude off of the sextant scale and wrote it
down. I then took eight more shots, reading out the altitudes and writing them down but without
the need to note the time for these eight shots. On the tenth shot I used the same procedure as for
the first shot and the noted time became the ending time of the series of shots. I then averaged the
starting and the ending time to find the average time of the observations, and this was the normal
procedure for determining the time of the observation. I found out on this flight that it took me a
few seconds more or less than three minutes to take the ten shots without the use of the averager.
For information on the operation of the A-7 sextant averager see:
https://www.NavList.net/m2.aspx?i=116307
Although you can take any number of shots, it makes it a lot easier to find the average if you take
exactly ten shots because it is much easier to divide the total of the readings by ten than by any
other number, just by moving the decimal point. Since we don’t normally deal with sexigesimal
numbers (base 60) we must use a special method to find the average of measurements taken in
degrees and minutes. To find the average you add up the minutes and degrees in separate
columns. Divide the sum of the degrees by the number of shots, simply moving the decimal point
if you have taken ten shots. You now have degrees and decimal degrees after the decimal point.
To convert the decimal degree part to minutes just remember that 0.1 degree is 6 minutes and
0.01 degree is 0.6 minutes. For example, say the total degrees of ten observations is 674 and the
total of the minutes is 162. Move the decimal point of 674 total giving you 67.4. then multiply
the “4" by 6 to convert to minutes making this part of the average 67̊ 24'. Next divide the sum
of the minutes, again just moving the decimal point if you have taken ten shots, and this gives
you 16.2' which you then add to the minutes found in the first step so the average then becomes
67̊ 24' plus 16.2' which equals 67̊ 40.2'. It takes about a minute and a half to average ten sextant
shots using this method. (If you were using a calculator you would have to convert all the
measurements to decimal degrees, add them up, divide by the number of shots and then convert
the result back to degrees and minutes format. It is easier doing it by hand. Noonan didn’t have a
calculator so he had no choice.)
When trying to find a destination using the “celestial landfall” procedure being used by Noonan
you don’t actually have to plot the lines of positions that you could derive from the sextant shots
as you would for normal position finding since you are only interested in how far you are from
the destination, which is the same distance that you are from the LOP running through the
destination. In the normal process of celestial navigation the navigator picks a nearby spot on
earth (which he calls the “assumed position” or A.P.) and by using various trig tables, computes
the altitude of the sun that he would have measured if he had actually been at the chosen A.P. He
then compares this “computed altitude” (Hc) with what he actually measured with his sextant. If
he happened to be at the A.P. then the measured altitude would be the same as the Hc. If it is
not, then he subtracts the smaller from the larger and the difference in minutes of arc equals the
number of nautical miles that he is away from the A.P. If he measured a higher altitude then he
knows he is closer to the sun than the A.P. is and if his measured altitude is lower he knows he is
farther away from the sun. Since the important piece of information to have is the Hc at the
destination, the normal procedure when accomplishing this type of “landfall” is to use the
destination as the A.P. for the computations. Since, as part of the computation process, the
navigator also computes the direction, or azimuth to the sun, the navigator then knows in which
direction he is located in relationship to the A.P. and he also knows how many miles he is off by
the difference between his measured altitude and the Hc. In Noonan’s case he was approaching
Howland Island from the southwest and he had computed that the azimuth of the sun, which
remained for about an hour after sunrise at Howland, as 67̊. So he would know if the altitude he
measured was less than what would have been measured at Howland at the same time of day that
he is till somewhere to the southwest of Howland. If he measured a higher altitude then he would
have known that they had overshot the island.
For more information about the landfall procedure see Flight Navigation (1938) written by
Noonan’s friend P.V.H Weems:
https://sites.google.com/site/fredienoonan/resources/weems/weems-394-395.JPG?attredirects=0
and
https://sites.google.com/site/fredienoonan/resources/weems/weems-396-397.JPG?attredirects=0
For other standard navigation manuals’ treatment of this process see:
https://sites.google.com/site/fredienoonan/topics/landfall-procedure
and:
https://sites.google.com/site/fredienoonan/discussions/navigation-to-howland-island
Using the trig tables that Noonan was using ( Navigation Tables for Mariners and Aviators, U.S.
government publication number H.O. 208, see:
https://sites.google.com/site/fredienoonan/resources/dreisonstock-h-o-208) for doing the
computations, it takes about four minutes to compute the altitude and azimuth for each sun
observation. This also requires concentration so it would be possible to make math errors,
especially late in the flight as they approached Howland after nineteen hours in flight. Because of
these considerations it was common practice, before takeoff, to estimate the time of arrival and to
do all the necessary computations on the ground before even getting into the aircraft. Once the
time of takeoff was determined the navigator or ground support personnel would do the
computations for the estimated time of arrival (ETA) and for a couple of hours before and after.
(Earhart sent a radiogram the day before they took off telling her husband that they would take
off at 9:30 a.m. on July 2, 1937. They actually took off at 10:00 a.m. Noonan had all the
information he needed to do all the computations the day before takeoff so would not have
needed to do them in flight. If he didn’t do the computations the day before he could have done
them during the early part of the flight before becoming fatigued. Doing the computations at the
same time for the entire period of possible arrival allows you to do them in production line
fashion, cutting the individual computation times about in half to about two minutes per data
point computation.)
Since, at the time of doing this precomputation process, the navigator would not know the exact
time that he would be taking his sextant shots, it would not be possible to do the computations
for those exact times. The navigator dealt with this problem by doing the computations at
intervals (usually every twenty minutes) and plotting the computed altitudes and azimuths on a
graph against time. Then, when the navigator had taken his sight, he simply looked at the graph
for the time of the shot to determine the Hc, instantly comparing it with the measured altitude,
and he then instantly knew how much farther he had to go to get to his destination or on to the
LOP that ran through the destination. No heavy computations needed to be done, just the
averaging of the shots and the subtraction of the measured altitude from the graphed Hc values.
For make more information available on the making these graphs of precomputed altitudes, I
have posted excerpts from four contemporary flight navigation manuals as well as a newspaper
article written by Noonan at:
https://sites.google.com/site/fredienoonan/topics/precomputed-altitude-curves
Based on my sextant shots on the way to Catalina on Sunday I now know that the observations
take between 2 minutes 47 seconds and 3 minutes 9 seconds and the manual averaging about
another minute and a half. Then comparing the average of the sextant shots with the graph takes
less than another minute so it would have been very easy for Noonan to take a sun sight every six
or seven minutes as he approached Howland to determine how much further they had to go and
to confirm that they were staying on the LOP once they had intercepted it.
Since I wanted to do the whole process on the flight to Catalina, I did the precomputations the
night before and drew the computed altitude curve on a graph that I took with me in the plane.
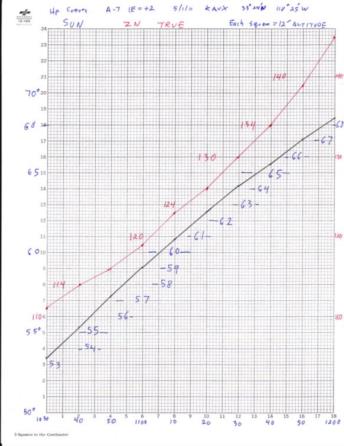
Attached as graph 1 is the small scale graph showing the altitudes and azimuths computed for the
Catalina airport for May 1, 2011 for the period of 10:30 a.m. to 12:00 noon. On the scale of this
overall graph, each division represents 12' of altitude change so would not allow me to read out
the computed altitudes to the necessary level of precision. I made this graph only to show the
overall process.
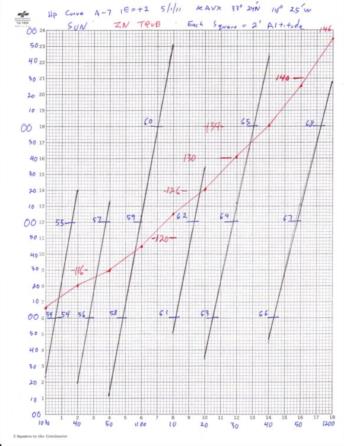
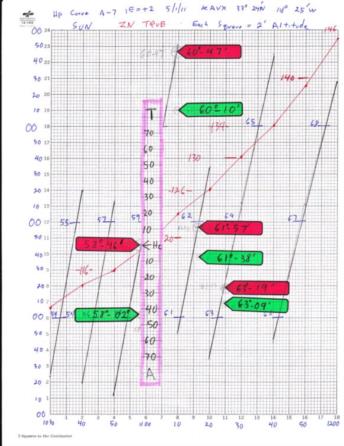
Attached as graph 2 is the actual graph that I prepared for taking on the flight. On this graph I
broke up the altitude curve into sections so that now the divisions represent only 2' of altitude so
it is easy to read out the computed altitudes to a precision of 1', equal to a one nautical mile
accuracy on the ground.
I had only enough time to take four observations on this short flight.
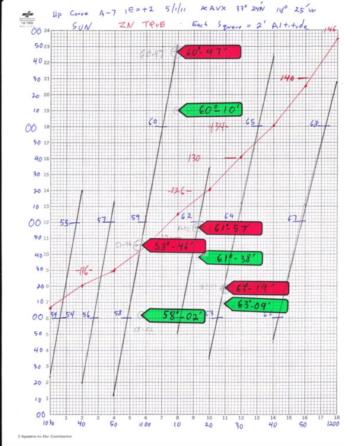
Time: 10:58:07 11:09:23 11:16:09 11:24:37
The computed altitude: 58̊ 46' 60̊ 47' 61̊ 57' 63̊ 19'
The measured altitude: 58̊ 02' 60̊ 10' 61̊ 38' 63̊ 09'
Dtance to destination: 44 NM 37 NM 19 NM 10 NM
Azimuth: 118̊ 123̊ 125̊ 128̊
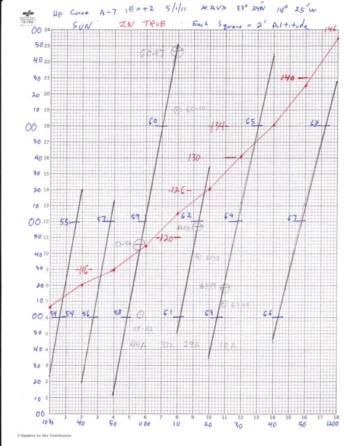
Graph 3 shows the final graph with my sextant observations plotted on the graph and the
computed altitudes marked on the graphed altitude curves. The differences between the
computed altitudes and the plotted measured altitudes determines the distance remaining to the
airport on Catalina. Graph 4 is the same as graph 3 but with colored flags pointing out the
markings of the computed altitudes (red flags), measured altitudes (green flags.)
I also made a ruler so I could just measure the distances between the computed altitude and the
measured altitude so I didn’t even have to do the subtraction. On Graph 5 I have placed the ruler
(in pink) next to the plotted altitudes for the 10:58:07 observation. I lined up the “Hc” index with
the computed altitude and read out the distance to destination at the plotted observed altitude, 44
NM.
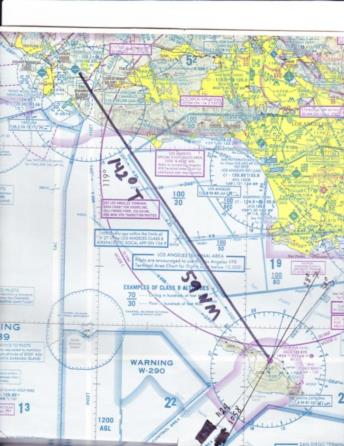
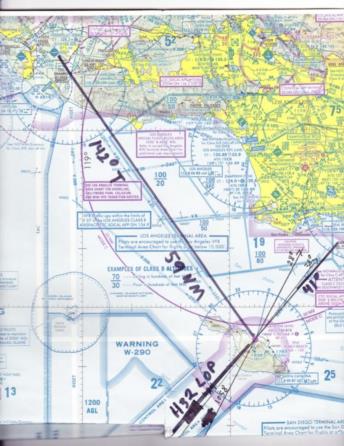
On chart 2 I have plotted the LOPs through the Catalina airport at times 10:58 and 11:24. During
this time the azimuth to the sun changed from 118̊ to 128̊, a change of 10̊ making the resulting
LOPs (that are at right angles to the azimuths) change from 028̊ /208̊ to 038̊ /218̊. The LOPs
for the two intermediate times fall between the two plotted LOPs.
Doing some dead reckoning, we can see that we moved toward the destination from 44 NM at
10:58 to 10 NM at 11:24, 34 NM in 26 minutes making our ground speed 78 knots. At this speed
we will cover the remaining 10 NM to the airport (or LOP) in 7 and a half more minutes making
the ETA 11:32. Looking at our graph we see that the azimuth of the sun at 11:32 is 131̊ so the
resulting LOP runs 041̊/221̊ and I have drawn this LOP on chart 3. To accomplish the landfall
procedure we do not actually need to plot these LOPs, we can just continue until our measured
altitude is equal to the computed altitude at the destination, look at the graph to find the azimuth
of the sun at that time and then turn 90̊ away from that azimuth which then puts us on the LOP.
We would know which way to turn because we would have aimed off to one side of the
destination.
Although not necessary for the landfall procedure, I have plotted the LOPs derived from my four
observations on chart 5 to look at the effect of normal observational errors on the calculated
ground speed. If you measure the distances between consecutive LOPs and divide by the time
periods you will find wildly varying ground speeds. This is the result of normal observational
inaccuracies, times determined only to the whole minute. and distances to the whole mile all
combined with very short time intervals. Using the spacing between the first and last LOPs, 34
NM and 26 minutes, produces a more accurate ground speed of 78 knots due to the longer base
line and time interval. The plotted spacing between the first and second LOP is 7 NM, the time
interval was 11 minutes so the calculated ground speed was only 38 knots. Doing the same
computation between the second and third LOP we determine a ground speed of 154 K, and
between the third and fourth LOP the ground speed was 90 K.
Since this is the third millennium, I could determine the actual errors in the sextant observations.
I had with me a GPS unit that records its position every five seconds. I downloaded my actual
GPS positions for the times of the sextant observations. I then did the normal calculations to
determine the altitudes that should have been measured at those positions and times. By
comparing what I should have measured with what I actually measured I determined the errors in
each of the observations. The first observation was 3' too high; the second, 2' too low; the third
observation, 6' too high and the fourth was 1' too high. These are pretty good results. Allowing
for these errors, which resulted in incorrect spacing of the LOPs, we can determine more accurate
ground speeds of 65 K, 86 K and 105 K with the overall ground speed being 83 K. Still some
variations due to measuring the spacing only to the whole mile and the time to the whole minute
and the spacing and time intervals are still short. Using the more accurate ground speed of 83 K
and the correct distance from the 11:24 observation of 11 NM would provide an ETA of 11:32,
the same as the less accurate ground speed previously determined.
So my conclusions are:
1. The pioneer type of sextant used by Noonan provided sufficient accuracy to find Howland
Island.
2. Taking 10 sights for hand averaging takes about 3 minutes.
3. Computing the average by hand takes less than 2 minutes.
4. Comparing the observed altitude with a precomputed altitude on a graph takes less than 1
minute.
5. That Noonan could have taken sights every 6 or 7 minutes to find and track the LOP through
Howland (assuming that he had prepared a precomputed altitude curve graph early in the flight or
the night before. This is a reasonable assumption as it was a published and well known
procedure.)
6. If Noonan had not precomputed the altitude curve then he would have been able to take a
sight, determine the average altitude and then calculate the computed altitude and distance to go
in about 10 to 12 minutes.
6. An interval of about 30 minutes allows finding a sufficiently accurate ground speed for
intercepting an LOP and completing a landfall.
----------------------------------------------------------------
NavList message boards and member settings: www.fer3.com/NavList
Members may optionally receive posts by email.
To cancel email delivery, send a message to NoMail[at]fer3.com
----------------------------------------------------------------
