NavList:
A Community Devoted to the Preservation and Practice of Celestial Navigation and Other Methods of Traditional Wayfinding
From: Frank Reed
Date: 2023 Jan 8, 12:50 -0800
Russ Sampson, you wrote:
"Very interesting problem. One thing to consider is the geometry of the array. If the map is correct then the spacing is neither orthogonal (i.e., like ordinary graph paper) nor aligned with the cardinal points. I am guessing this may have to do with meteorology (prevailing winds) and aerodynamics (downwind turbulence)."
Yes, the map from the wind farm company appears to be relatively accurate. As you say, the orientation was presumably determined by some characteristics of prevailing winds. There are now huge wind farms beginning construction off our coast here in New England, too. One of those Danish companies (as implied in Alex Eremenko's post) is the lead, and they have spent a fortune already rebuilding the old "State Pier" in New London to serve as the primary port for the big project. I don't know when the first of hundreds of turbines will be planted out there, but it should be this year. Of course there's a tiny "test" farm with five huge turbines just southeast of Block Island that's been producing power for years. That has helped to ease local concerns from the fussy wealthy people that their "view" would be ruined. Most people do not notice the Block Island turbines at all since they closely resemble sailboats at a great distance.
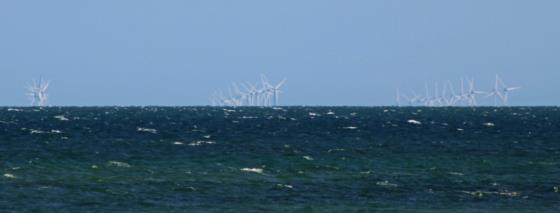
Again, here's the view looking east from that beach in southern England:
Viewed as a physics/math problem, we can figure out how the apparent heights of the turbines falls away beyond the horizon since the more distant turbines are further around the curve of the Earth. By measuring the heights of the turbines (actually I think the central hub of each turbine would be the best choice here), we can figure out how far away each turbine is with distance increasing as we go down the row. At first glance it's a problem in pure Euclidean geometry, but photons don't follow straight paths in air. They refract as they travel, and that implies some adjustment similar to the adjustment in the standard equation for the dip of the horizon [geometrically, dip in minutes of arc would be about 1.06·sqrt(ht in feet) but refraction lifts the horizon and on average the "better" dip formula is 0.97·sqrt(ht in feet)].
The general problem here is "distance by vertical angle" and there is an adequate table in the "American Practical Navigator" (Bowditch) accompanied by endlessly screwball explanations through the decades. The equation is quadratic, and when printed up it has a square root with a long vinculum covering two out of three terms. They got that wrong repeatedly, and there have been discussions of this error going back decades in NavList messages. On top of this they use tan(x) for small angles, which is absurd in practical cases since the measured angular altitudes of anything, even mountains, beyond the horizon will always be less than 10° or even 5° and usually less than 1°. This is bad geometry, jumping for a trig function when a simple arc conversion will do (minutes of arc divided by 3438 converts an angle in common sexagesimal measure to a pure ratio). On top of this oddity, the tangent of the angle in question is then immediately divided by a very small number, either 0.000246 or 0.0002419 depending on the edition of the Bowditch. Now who in their right mind thinks that dividing a number by 0.000246 is better than multiply by 4060??! It's such a mess. But we can fix!
A couple of years ago, I did an online presentation on a better equation for this problem, significantly cleaned up mathematically and explained/generalized in terms of the variable refraction problem. I wrote it up later with three posts including some diagrams here: Distance by vertical angle thread, October 2020.
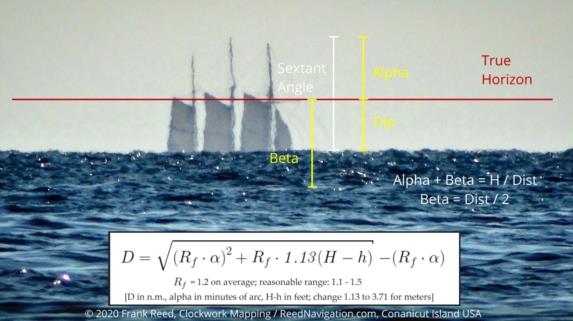
The bottom line is this cleaned up formula:
D = sqrt[(Rf·α)2 + Rf·1.13(H-h)] - Rf·α,
and if you want to stick with mean refraction, you get
D = 1.2·[ -α + sqrt(α2 + 0.94(H-h))],
where H and h are in feet, and the angular height above the true horizon, α (alpha), is in minutes of arc, and the resulting distance, D, is in nautical miles, and the factor Rf is a pure number (no units). This factor Rf is the "Earth radius amplification factor" (I just made up that name but it fits), and it depends on weather. Refraction in surface-grazing light rays has the effect of making the Earth seem larger than it is by some moderate percentage. An excellent mean value for Rf is 1.2 but anything in the range of 1.1 to 1.5 should be considered reasonable, and it's worth experimenting with different values of Rf. The actual value of Rf is a function of the temperature profile in the boundary layer of the lower atmosphere. The angle alpha, α, is easily misinterpreted. It is not the angular height of the top of the object above the sea horizon that we measure with the sextant, but rather it is the angle above the true horizon, which means that we have to subtract the dip from the sextant angle to get alpha. Note that the dip should also include the variability of Rf: dip = 1.064·sqrt(h/Rf). Also note that by this definition, α can easily turn out to be a negative number. That happens when the angular top of the object is below the true horizon but still above the sea horizon, or in numerical terms, when the sextant height above the sea horizon is smaller in absolute value than the dip.
Oh, how I would love to have photos of those wind turbines taken on different days and at different times of day! As the value of Rf changes, the visible tops of the turbines would rise and fall as if mounted on a breathing giant. And I think that's probably the most interesting thing we can get out of the photo as given: what was the value of Rf, the "Earth radius amplification factor", at the time this photo was taken? By the way, I recall from the caption that the photographer was standing on the beach here. At a reasonable location, that implies a height of eye, h, of something like 10 or 12 feet.
There comes a moment in the history of this table and formula in Bowditch where the editors were clearly bowled over by an unfortunately intricate article by someone with a math/physics background who chose to make things as complicated as possible. Starting in 1958, Bowditch had included a proper table but a mangled equation in the explanation. The equation was fixed in the 1962 printing and from it we can tell that they were using an Rf value of just about 1.2, but very poorly expressed in their version of the equation. In 1968 an article was published in the Journal of the Institute of Navigation (the US journal) by William Guire. He produced a detailed but way over-the-top derivation creating a grand illusion of high science, and the editors of Bowditch by 1975 declined even to include a formula. They were blown away. In following years (starting, it seems, in 1981) they tried and tried again to get the updated equation right but it was still a mangled mess. Judging by their constants in the formulas as published, the only change compared to the table in 1958 was that Rf was shifted from 1.2 to 1.18. This is a trivial difference, and it was entirely un-necessary. Even in modern editions of Bowditch you'll find the absurd formula with constants like 0.0002419. Just a mess...
A few details that I've worked out from the photo and the map: The spacing between the rows as seen from the beach is about 0.356 nautical miles. The distance to the nearest turbine is about 14.8 nautical miles. From there an angular scale on the photo follows, right? I think I've done things right up this point.
Frank Reed
Clockwork Mapping / ReedNavigation.com
Conanicut Island USA


