NavList:
A Community Devoted to the Preservation and Practice of Celestial Navigation and Other Methods of Traditional Wayfinding
From: Peter Hakel
Date: 2009 Jul 11, 10:18 -0700
I attach a spreadsheet into which I loaded one of George's data sets: Identity code 40004.61088.
I do not know for sure what values to use for speed and course but those interested can easily change them in the spreadsheet to match their understanding. I selected a SW course in order to examine the effect of the vessel moving across parallels as well as meridians.
The coordinates of the fix are displayed in the cyan-colored cells F9-11 and F16-18. These values pertain to the instant when the LAST measurement was taken: i.e. 13:10:00 in this case. I figured the navigator would prefer to know where he is "now" rather than where he was "a while ago."
Input (green cells):
Column A: Universal Time
Column B: observed altitudes (one could use uncorrected altitudes and correct at the end to save some work, a fine point)
D1: speed in knots
D2: course; both D1 and D2 are assumed constant throughout
D4: number of observations
D6,D7: Date (this is used to calculate the Sun's approximate rate of declination change)
F3: Sun's declination at the moment of the last measurement (at 13:10:00 in this case)
F4: N or S depending on the observer's general location
F5: N or S depending on the Sun's approximate bearing
F14,F15: equation of time (EoT) at the (computed) LAN displayed in the yellow cell F13.
In this case the EoT is positive, so the F15 cell is left blank.
Cells D14-D16 are used to calculate EoT by interpolation, no need to worry about that here.
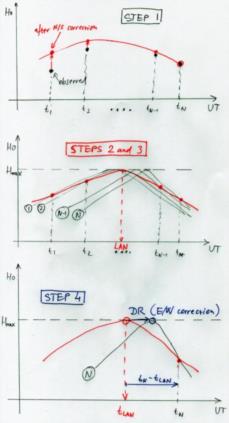
The spreadsheet goes through the following steps (see the attached sketch, N observations, no random scatter included):
1) It advances all observed altitudes (black) to what they would be (red) when seen from a common parallel of latitude. This I chose to be the position of the last observation. The procedure takes into account both the N/S motion of the vessel as well as the changing declination of the Sun in a manner described before by George, Frank, and others.
In the sketch this correction is positive because in our example the N/S component of the vessel's speed points toward the Sun and we are advancing the altitudes forward in time. The last altitude recorded at time t_N is unchanged by this.
2) It calculates the maximum altitude Hmax and the corresponding UT by least-squares formulae for a parabolic fit.
We now have the latitude (F9-11) and the instant of LAN (F13 = t_LAN).
3) It uses the EoT (F14, F15) to convert LAN UT (F13) into longitude at LAN (cell N22).
4) Longitude from 3) is advanced by the dead-reckoning formula (N23) to the instant of the last observation. The time interval is t_N - t_LAN (in blue).
The sketch actually shows a different but equivalent procedure of calculating the LAN/longitude that the observer would have gotten if he had been observing the curve while at rest the whole time at location N (with the Sun's declination change transformed out in Step 1).
Some comments regarding Step 2:
There is a continuous infinity of "local noon curves" at each meridian that the vessel crosses between t_1 and t_N. After Step 1, all these (black) parabolas (1, 2, ..., N-1, N) have the same shape and height Hmax (I ask you to forgive my limited artistic skills. :-) ). They differ only in their overall horizontal shift depending on their corresponding meridian. As time goes on, the observer picks up the red values from whatever black parabola is in play at that moment of UT. This constructs the red trace, which will have the same Hmax as all the "local" parabolas.
The E/W motion of the vessel causes the red trace to have a curvature different from the black curves. In the sketch the red trace is a bit stretched out because in our example the vessel has a westerly speed component thus chasing the Sun (so the black parabolas advance from left-to-right with UT). The uniformity of the vessel's speed and course is an important ingredient here, because it provides a LINEAR correspondence between the UT and the local parabolas' positions on the graph. As Frank pointed out back in 2005 (when he also discussed things like completing the square), a linear rescaling of a parabola is another parabola. Therefore, no rigorousness is lost in using quadratic fitting techniques to extract the Hmax and t_LAN from the RED curve.
I use least-squares fitting formulae from my latest favorite book: Astronomical Algorithms, Second Edition by Jean Meeus, p. 43. These formulae are the determinant solution of the 3x3 linear system arising from least-squares fitting with a quadratic curve.
Peter Hakel
--~--~---------~--~----~------------~-------~--~----~
NavList message boards: www.navlist.net
Or post by email to: NavList@navlist.net
To , email NavList-@navlist.net
-~----------~----~----~----~------~----~------~--~---


