NavList:
A Community Devoted to the Preservation and Practice of Celestial Navigation and Other Methods of Traditional Wayfinding
From: Frank Reed
Date: 2022 May 5, 11:26 -0700
Hello Ed,
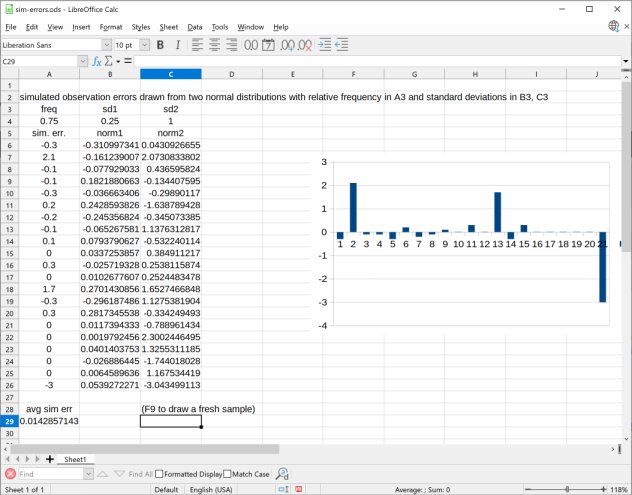
I find that manual sextant observations show errors that act as if they are taken from two distinct normal distributions with significantly different "widths" (standard deviations). When I model sights for analysis, I actually simulate them by taking model errors from a distribution with a narrow error spread about 80% of the time and from a distribution that is three times wider in the remaining cases. So, for example, when simulating a set of lunar distance observations, I would pull them from a distribution with a standard deviation of 0.25 minutes of arc four out of five times, and from a distribution with an s.d. of 0.75' for the last out of five. This sort of distribution seems to match what I see in observations, and I think there's a good "plausibility argument" for it.
I'm attaching a small spreadsheet that simulates a set of observational errors.
So what can you do with simulated errors? When we see a wild error in a set of sextant observations, we can often spot it "by inspection". For example, you might record an altitude of 45°23' as 55°23'. Normally we throw these out. But is there a systematic way of detecting and rejecting outliers that are not so obvious? You can experiment with a set of simulated errors (like the ones in this spreadsheet) and perhaps come up with a simple rule that would work. For example, you take ten Sun sights in a row. You plot them on graph paper and draw a line through them. You might find that nine of your sights are within 1' of the line you've drawn, but one is 5' off the line. Can you throw that out? Maybe that's reasonable. This has been a hotly debated topic for at least 150 years. Are there ever circumstances when it's reasonable to drop points from a dataset? It is, in fact, a common procedure, but this is also sometimes considered outrageously bad science.
You could "roll your own" outlier test, or perhap's you could apply Chauvenet's Criterion or Peirce's Criterion. It is no coincidence that both of these names are connected with the history of nautical astronomy. Be sure to read the criticism of this whole idea of deleting outliers. You might imagine that this issue is strictly technical trivia of interest only in statistical theory. In fact, the legitimacy of "dropping outliers" made it onto the stage of popular culture recently in an episode of The Dropout, a dramatization of the rise and fall of Theranos and its CEO Elizabeth Holmes, and in the real world in the trial of Elizabeth Holmes.
Frank Reed


